Introduction
We are now at the halfway point of the NLF and fantasy football season. You would think that rookies and players on new teams are better integrated into the team: getting to know their team and the playbook better. But is this really the case? That’s what we are testing in this article.
First, we compare the production of rookies in the first half vs the second half of the season. Then we evaluate players who were already in the NFL in their first year with a new team. Once we know the tendencies for the various position groups, we will dive deeper into the data for players who are currently in the NFL and interesting for fantasy football. Do players heat up the second half of the season, or do they cool down? Let’s dive into the data!
Methodology
This article uses weekly player data from the 2015 – 2024 seasons. This ensures a large enough dataset where most data for players with a longer history in the NFL is used as well. Also, with this time period the tactical changes in the NFL don’t skew the data too much, whereas this is the case when using a longer time period.
When we talk about the first and second half of the season, we talk about dividing the season in weeks 1-9 (first half) and weeks 10 until the end of the regular season (second half).
For players and position groups in their season with a new team, I include only veterans. This means no rookies or other first-year players.
For the 2025 stars and busts, only players with at least 3 seasons of data are analyzed. This gives a better overview of the yearly trends, instead of only looking at 1 or 2 seasons, where the change in 1 season can be the result of an injury or coach change during the season.
Last, but certainly not less important, fantasy points are based on PPR scores.
Performance of rookies
To get an overview of how rookies perform historically in the first vs. the second half of the season, data is used from 2015 – 2024. This gives us a dataset of 896 players. For each position, a second dataset is created with rookies who made an impact right away and see the difference in their numbers. One big assumption in fantasy football is that rookies tend to perform better after a bye week or in the second half of the season. What does the data say?
First of all, let’s have a look at the overall record for the 896 rookies. In the first half of the season, they scored an average of 7.22 fantasy points per game (FPPG). Not too bad, considering many late-round rookies see very limited opportunities. In the second half of the season, they scored an average of 7.59 FPPG. A small increase, but not dramatic. Although this gives an indication, these stats don’t give a good indication of what this means per position group.
Quarterbacks
Let’s have a look at quarterbacks first. When writing this article, I assumed quarterbacks are the least ‘gray-area’ position. If they start week 1, they usually continue to start the whole season (barring injury, coaching changes or very bad quarterback play). The data backed my assumption: in the first half of a rookie season, quarterbacks score 12.38 FPPG. In the second half this number is almost identical at 13.13 FPPG. Surprisingly, better playbook knowledge and chemistry didn’t translate to a large FPPG jump.
Looking at pass attempts, rookie quarterbacks average 30.67 pass attempts per game in the first half of the season. In the second half, this number drops to 29.94. This is interesting, because the quarterback group scores 0.75 FPPG more in the second half of the season. Also, the pass yards per attempt are down from 6.79 to 6.61. Rush attempts are down too, from 3.78 to 3.62 per game. What does increase, are passing touchdowns per game, from 1.04 to 1.14.
The impact group of rookie quarterbacks consists of quarterbacks with at least 100 pass attempts per season half. This gives us a dataset of only 24 players. In the first half of the season, this group scores 14.44 FPPG. In the second half, they score 15.95 FPPG. The trends we saw with the larger rookie quarterback dataset is also visible in this impact group dataset. Pass attempts went down from 32.32 to 31.99 per game and yards per attempt from 6.86 to 6.75. Rush attempts, however, went up from 3.88 to 3.99. Passing touchdowns also went up from 1.17 to 1.32.
Running Backs
The second position group are the running backs. And yes, rookie running backs tend to improve in the second half. In the first half, they score an average of 7.40 FPPG. In the second half, this rises to 8.07 FPPG. Looking at some of the most important indicators, all values have risen. Carries go up by 1.05 per game and the targets by 0.07 per game.
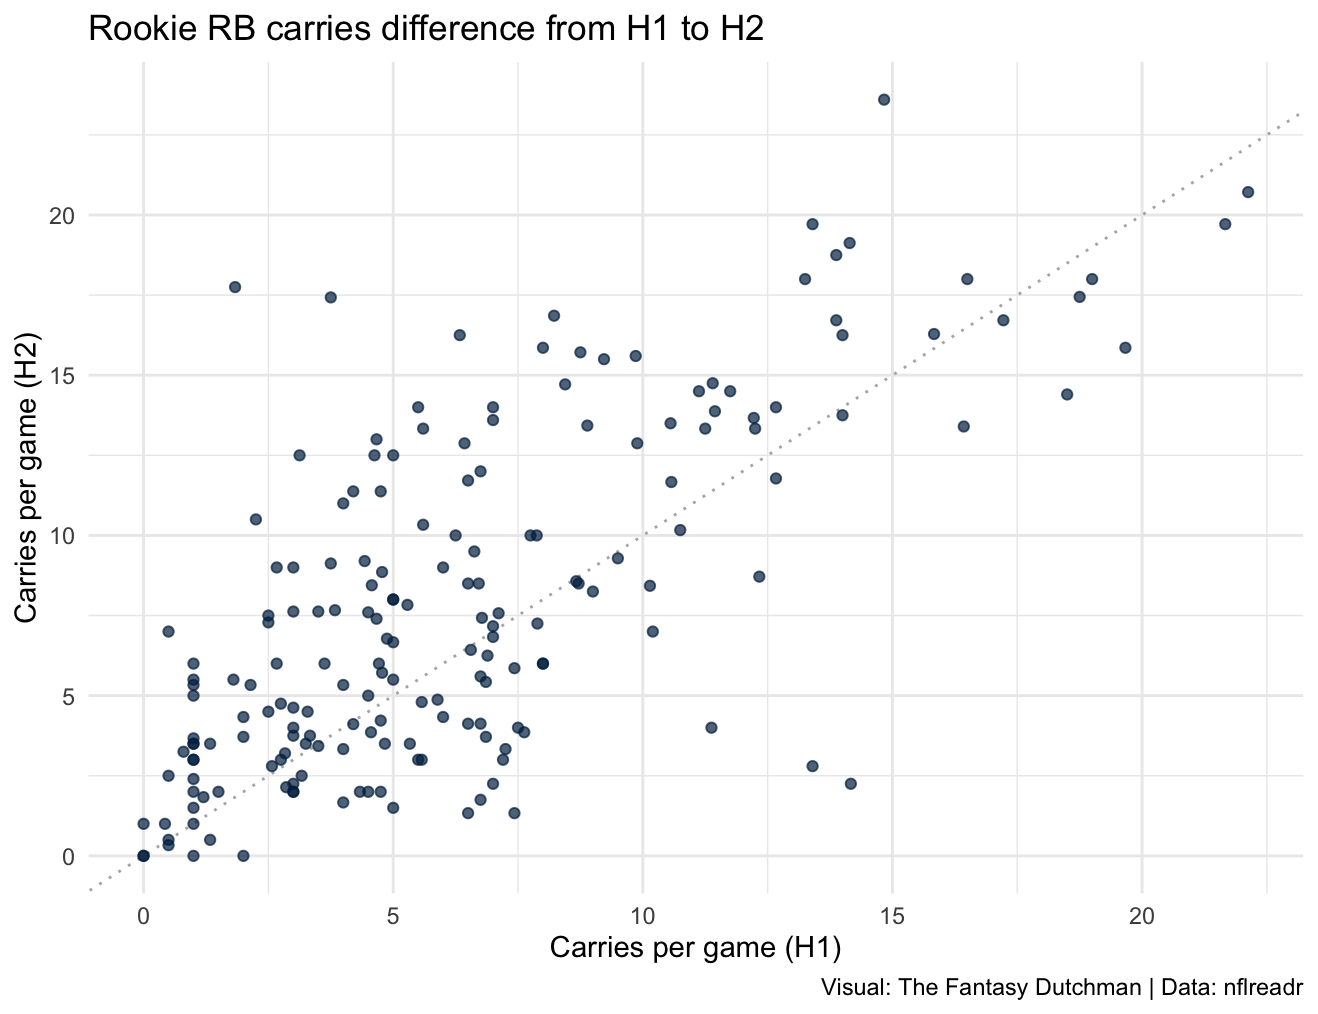
For the impact players dataset, we are looking at players who at least have 4.5 carries per game in both the first and second half of the season. This means a total of 92 eligible rookies. The difference in FPPG is noticeably larger, from 9.22 FPPG the first half to 10.82 FPPG the second half. This corresponds with the increase in carries per game (9.75 to 11.89), and targets per game (2.52 to 2.66).
Wide Receivers
With wide receivers we notice an increase in FPPG as well, from 6.82 to 7.18. Not a big jump, do targets/touchdowns follow? Well, yes. In the first half of the season, rookie wide receivers get an average of 3.96 targets per game, which rises to 4.18 per game in the second half of the season. Touchdowns also rise from 0.18 per game to 0.20 per game. However, yards per target dip despite the extra volume. In the first half of the season, rookies get 7.76 yards per target. In the second half, this is 7.71. A small but notable decrease.
For the impact players, we are looking at players with at least a 15% target share in both the first and second half of the season. This gives us a dataset of 52 players. In the first half, this group scores 11.82 FPPG. In the second half this increases to 12.39 FPPG. The targets of this group stay roughly the same at 6.52 in the first half and 6.84 in the second half. The decrease in yards per target is for this group noticeable as well, 8.41 in the first half compared to 8.16 in the second half.
Tight Ends
The final position group is the tight ends. Like wide receivers, tight ends see a small FPPG increase. In the first half they score 5.07 FPPG, in the second half this rises to 5.20 FPPG. We see more similarities to the wide receiver group. Targets are up slightly from 2.9 per game to 3.06, touchdowns stay the same at 0.16 per game. Yards per target though, are decreasing here as well, from 7.35 in the first half of the season to 7.16 in the second half.
The impact players for the tight end group have a target share of at least 9.9% in both the first – and second half of the season. This means a dataset of 25 eligible tight ends. The FPPG raises from 7.84 to 8.07. Targets increase from 4.55 to 5.06. Although, yards per target decrease from 7.71 to 7.13.
Summary
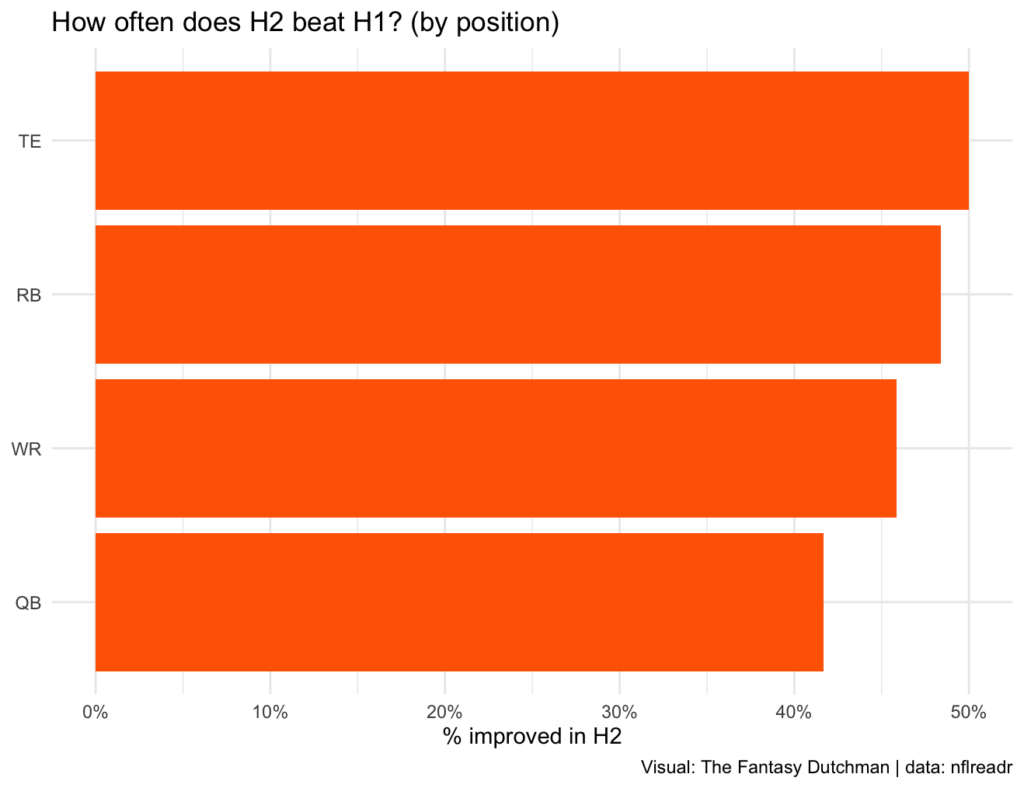
As we can see from the data, rookies tend to do a little better in the second half of the when looking at FPPG. Every position group shows an increase, though amounts vary. The rise is more notable for quarterbacks and running backs and smaller for wide receivers and tight ends.
What does stand out though, is the fact that a lot of indicators are decreasing, even when the FPPG are going up. That occurs in both full samples and impact samples. This means there are no clear indicators why FPPG go up in the second half compared to the first half of the season for rookies.
First year with a new team
When talking about first year with a new team we only talk about players who were already in the NFL and join a new team, so no rookies or players who enter the NFL for the first time. Data is used from the seasons 2015 to 2024. This gives us a dataset of 422 players.
Quarterbacks
Quarterback, especially back-ups, tend to switch teams frequently due to injuries to starters or back-ups. To avoid skewing the data too much, I have decided that players should at least had 25 pass attempts in both halves of the season.
When quarterbacks join a new team, the first half of the season they score 13.88 FPPG. In the second half of the season, this number drops to 13.33 FPPG. Diving deeper into this data, quarterbacks had an average of 31.23 pass attempts in the first half of the season and 31.26 in the second half. This isn’t where the difference is made. With rushes, the same applies where the difference is minimal. In the first half of the season, 2.8 rushes are attempted per game, in the second half this number is 2.85. Do we see any difference in passing touchdowns which explains the difference? Not in the favor of the first half of the season, where 1.27 passing touchdowns are thrown on average. In the second half, this number increased to 1.38. Looking at interceptions, the number increases in the second half. From 0.65 to 0.80 in the second half.
Running Backs
Running backs change teams less often than quarterbacks. Still, many notable starters appear in the sample. When we look at the FPPG, there is a clear difference between the first and second half. In the first half, the average FPPG is 13.40. This number decreases to 11.84 in the second half of the season. Of course, it could be that the element of surprise is gone and opponents now know how the player is used within the new system. But what else does the data tell us?
On average, running back rush 13.02 times per game in the first half of the season. In the second half, this number drops to 12.39. You would think with less rushes per game, the rushing touchdowns per game would drop too. This is true, but by a very small margin. From 0.49 to 0.47. The number of targets, however, does increase in the second half of the season, from 2.63 to 2.86. The receiving touchdowns do go down, from 0.09 per game to 0.05.
No single metric can fully explain the FPPG decline. The main indicator which indicates some correlation is the number of rushes per game, which drops by 0.63.
Wide Receivers
Especially aging receivers also tend to change teams a lot, when injuries happen to starters and reliable wide receivers are needed. When comparing the halves, FPPG is flat. First half of the season the score is 11.52 compared to 11.52 in the second half. This should mean the usage should be similar, right?
For targets this is indeed the case. In the first half of the season, wide receivers get on average 6.47 targets per game. In the second half, this number is 6.55. When looking at the yards per target, we get a small difference. In the first half, the yards per target are 8.47, but in the second half this number is 8.10. Although, this decrease is covered by the touchdowns per games, which is improved slightly in the second half: from 0.3 to 0.33.
The fantasy points per game and the indicators do correlate to the fact there is very little difference for wide receivers when comparing their first half and second half of the season.
Tight Ends
Tight ends improve in the second half. The first half they score 7.12 FPPG, the second half this goes up to 7.75 FPPG. Let’s see if the rest of the data shows an increase as well.
Targets for tight ends do go up: from 4.35 in the first half, to 4.52 in the second half. The yards per target are increasing as well, although this increase is very little. From 7.22 to 7.26 in the second half. A bigger increase is visible in the touchdown department. In the first half, the tight end group scored 0.17 touchdowns per game, in the second half this increases to 0.25.
The tight end group shows a notable increase in fantasy points per game in the second half of the season. This is backed by the relevant indicators, where we see an increase in all departments.
Second half bright spots
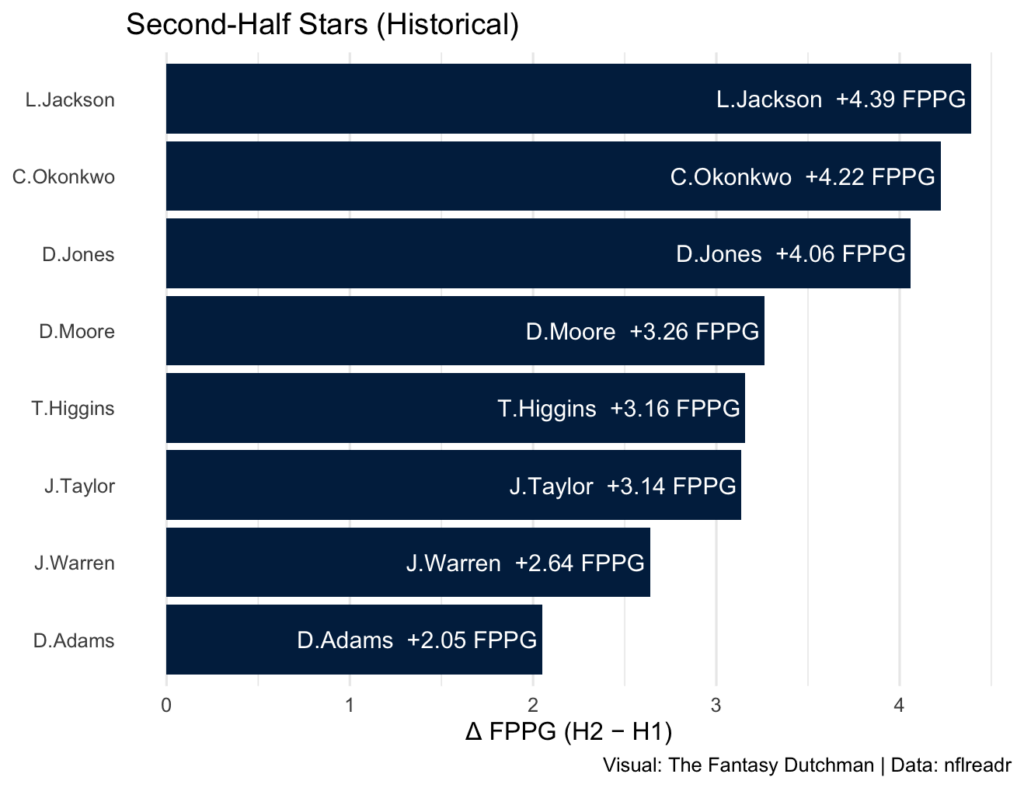
We are now getting into the second half of the 2025 season, so who are historically the bright spots in this period of the season? To find out, we looked only at players who have at least 3 seasons of data. Seasons where they were in their first season with a team are not included.
Quarterback stars
When looking at quarterbacks, two quarterbacks stand out. And maybe this is a coincidence, but these quarterbacks stood out in the first half of the 2025 season already.
Lamar Jackson
Historically, when Lamar has a healthy season, he shows a lot of improvement in the second half of the season. Even with the first half seasons Lamar has had, which are already at the top of the league. In the second half, Lamar has a lot of second halfs, where he scores over 4 FPPG more. In 2024 he scored 25 FPPG in the first half, but he managed to improve by 0.5 per game in the second half.
Daniel Jones
Jones is one of the revelations of the 2025 season. In the first half of the season he is on pace for his best fantasy season of his career. Historically though, Jones is doing even better in the second half. Of the 3 eligible seasons in the dataset, Jones has one season of an improvement of 7 FPPG and one season of an improvement of 4 FPPG.
Running Back stars
Looking at the running back group, two players stand out. Just as with the quarterbacks, these players are being stars in the first half of the 2025 season already. What can the second half of the season bring them?
Jonathan Taylor
Taylor shows an improvement in every season. The smallest increase he has given us is 1.61 FPPG. The other 4 seasons were over 2.6 FPPG at minimum. He is pacing a career year, so expect some regression risk. Although, history says the late season lift is common.
Jaylen Warren
Warren has 3 seasons of data, and in each of those seasons his FPPG improves in the second half of the season. The smallest increase he had was 2.41 FPPG. Can he continue this trend and improve on his already best fantasy season of his career? Trend suggests he can build on a career-best start.
Wide Receiver stars
At the wide receiver position, 3 players have an interesting second half of the season historically.
Davante Adams
Adams has 8 eligible seasons. In 2 of these seasons, his second half was worse than his first. But what stands out more, is the fact that of the other 6 seasons, a lot of them were in increase of more than 4 FPPG. What can he show us in the second half of the season with Matthew Stafford at quarterback? With Stafford, there’s room for a second half push.
DJ Moore
Moore has 6 seasons of eligibility in this dataset. Only 1 of these seasons was negative, and in just 1 other he had an improvement of less than 1 FPPG. In 2 seasons, he gave us an improvement of 4 FPPG. The first half of 2025 wasn’t great for fantasy, and with a crowded receiver room in Chicago, what can he do the second half of 2025? At least history supports a bounce back.
Tee Higgins
Higgins isn’t the most reliable player when it comes to health. But where he is reliable, is he performs in the second half of the season. Of the 5 eligible seasons, only during his rookie season he performed worse in the second half. In all the other seasons he outperformed his first half by at least 2.9 FPPG. Second half stud this year with Joe Flacco?
Tight Ends
We have two tight ends who, historically, are stars during the second half of the season. Can they continue this in 2025?
George Kittle
Kittle has 7 seasons of eligibility in this dataset. Only in 2024 his second half was worse than his first half. A clear trend is the FPPG in which he improves in the second half every season. The first two seasons his improvement was > 3 FPPG, the third and fourth season the improvement was > 2 FPPG and the fifth season was > 1 FPPG, before his worse second half. Something we should worry about in 2025? At least history is pro-Kittle.
Chig Okonkwo
Okonkwo has 3 seasons of data. In each of these seasons he shows an improvement in the second half of the season. Each of those 3 seasons has an improvement of at least 2.75 FPPG. Is this something he can continue in 2025 with Cam Ward?
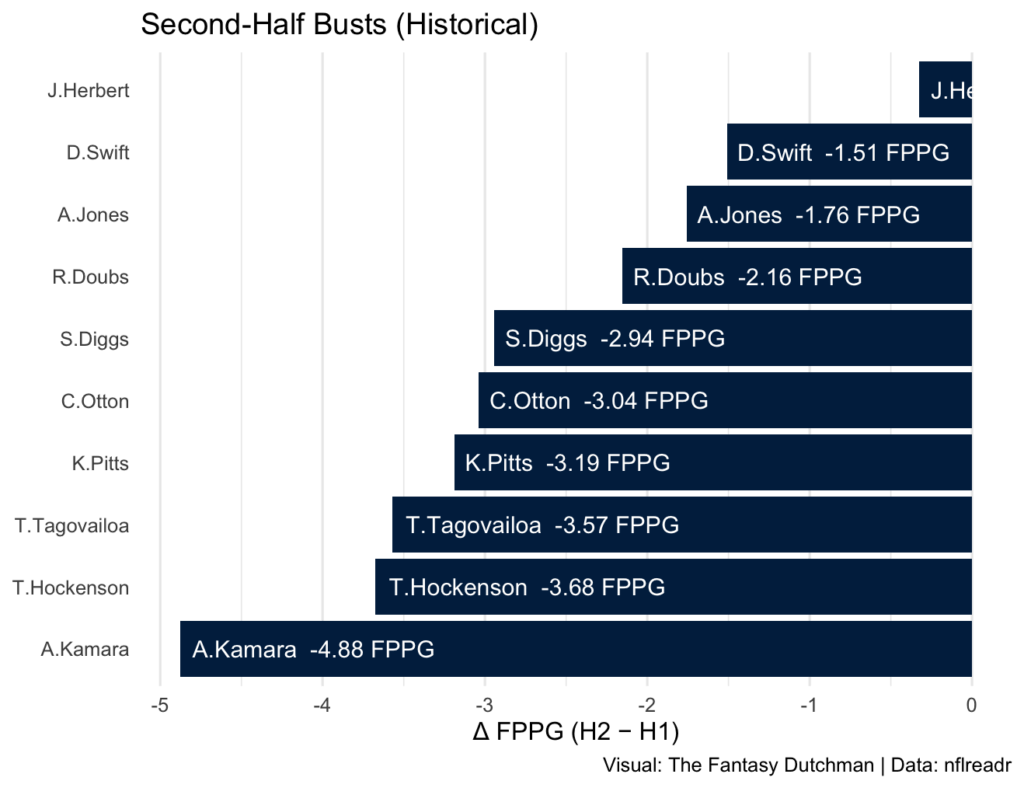
Second half busts
Who are the players you should worry about during the second half of the season. Are they on a heater now? Maybe you can sell high if you feel like it. Or do you trust the talent of the player enough to keep them on your roster?
Quarterback busts
Two current starting quarterbacks can be considered busts. Is this trend going to continue for them in 2025?
Justin Herbert
Yes, Justin Herbert is doing great this season. Yes, Justin Herbert has a great receiving core to throw to. Yes, Justin Herbert is dating Madison Beer and is playing better ever since. But the data doesn’t lie. Herbert has 5 eligible seasons. Of these 5, only his 2024 season he gave us an improvement in FPPG. The other seasons, he either declined a little by < 0.5 FPPG or a lot by > 4 FPPG. Do you believe in Herbert? If not, consider selling.
Tua Tagovailoa
We still don’t know who Tua is. He can have great games, or he is a bottom of the list starting QB. In 4 eligible seasons, only his 2024 season has shown an improvement in the second half of the season. The previous 3 seasons though, he always had a decline of more than 3.3 FPPG. This season, he is on track for his worst fantasy season since coming into the league. Do you trust a bounce back, or will this season go even worse?
Running Back busts
Alvin Kamara
Let’s start with one of the most frustrating fantasy players of the 2025 season. During his rookie season he improved his FPPG by 7.5 in the second half of the season. The following season? He declined in the second half. And those declines were not small. He has one season of 1.1 decline and one season of a 2.7 decline. The other season he at least shown a decline of 4.4. Three of those seasons his decline was more than 6 FPPG. With currently at his worst fantasy season ever, will he continue this trend of declining second half seasons? History suggests to be cautious, we’ll have to wait and see.
Aaron Jones
Jones has one season where he had a positive second half of the season, that was his second season in the league. The next 6 seasons his second half was always worse compared to his first half. Some of these seasons, the decline was marginal by < 1.5 FPPG. Although, he also has seasons where his decline was above 2.0 FPPG.
D’Andre Swift
During his rookie season, Swift showed a massive improvement in the second half of the season in FPPG. The other 4 seasons, however, he showed a large decline in the second half. One season the decline was manageable at ‘just’. 1.5 FPPG, but the other season the decline was always above 4.5 FPPG. He had a good first half, will the wheels fall off in the second half of the 2025 season?
Wide Receiver busts
Stefon Diggs
Currently, Diggs has an up-and-down 2025 fantasy football season. On average, he is on pace for his worst fantasy football season after his rookie season. To make things worse, of the 8 eligible seasons, he has only 2 seasons where he outperformed his first half of the season. The last eligible seasons (2022 & 2023) the decline was massive with -7.35 and 11.91 FPPG. What does this mean for 2025? We don’t know, but if this decline continues, he is barely a WR3 for fantasy.
Romeo Doubs
Doubs is in one of the most crowded wide receiver rooms in the NFL. In the first half of the season, he is getting a fair share of work though. What is worrying is the fact that in the 3 seasons he’s been in the league, he always declined for fantasy in the second half of the season. Currently, Doubs is averaging 11.7 FPPG. Historically, he has scored an average of single digits fantasy points per game in the second half, so keep this in mind for the second half of this season.
Tight End busts
T.J. Hockenson
Let’s start by the tight end with the most interesting stat of this group. He is a bust, because every season with Detroit his FPPG declined in the second half of the season. On the other side, in his first full season with the Vikings, he logged an increase in FPPG for the first time in his career. Was this a one-time thing, or is this a trend? The 2025 season isn’t great so far, so an increase would be very helpful for fantasy managers holding on to him.
Kyle Pitts
A lot of fantasy managers are frustrated with Pitts, every single season again. And I don’t think this feeling improved in the second half of the season, because in 3 seasons he always shown a decrease in FPPG. In 2023, this decline was less than 1 FPPG, but the other 2 seasons the decline was above 3 FPPG. The first half of his 2025 season isn’t as bad as the previous years, but are we getting a decline again?
Cade Otton
Otton is 3 seasons in the league, but every season he has shown a decline in the second half of the season in FPPG. This decline is also not very small: every season it’s above 2.0 FPPG. In the first half of the 2025 season, he has benefited from the absence of various receivers at the Bucs, will we see another big decline in the second half?